2023 Numbers, and 2022

It seems that last year I forgot to make my annual blog post summarizing the numbers for the farm’s prior year, so I’ll fix that here and give the update for the last two seasons. Short headline should be that 2023 was by far my worst farming year, financially speaking, ever. Embarrassingly so – but I’m still learning and these blog posts on the numbers are all about sharing to encourage others to run their numbers, learn and share, too, so here we go.

Partly because 2023 was so bad, and partly because I’m in the middle of planning out some changes anyways I spent a little more time with the numbers this year and generated some nice graphs so I’ll share a bit more than I usually do. The last one of these posts was on the 2021 numbers and you can see those by following this link (or just searching for “numbers”) in the search box.

The main number I track from year to year is what is best described as the “net dollars per hour generated” by the farm. Simply, this is the total revenues minus the non-labor expenses, divided by the total number of hours worked by everyone on the farm – including me, the owner. You can go back into the earlier blog posts for more on some of the things that can complicate putting this number together. I think of it as kind of an average hourly wage on the farm across all of the people who work on the farm. 

For 2022 the number was $18.19 per hour, which was actually the best number I’ve recorded in past 7 years of tracking at Cully Neighborhood Farm. I had a very similar number  ($18.17) in 2018 and that year I was able to give good bonuses to employees. Because the minimum wage was much higher in 2022 than in 2018, and more employees were above the minimum wage, that didn’t happen last year.

In 2023 the number was $11.74 per hour, well below minimum wage. When that average hourly wage drops below the loaded minimum wage it means that the employees are making more than the owner. By loaded minimum wage I mean minimum wage plus payroll taxes. Minimum wage in Portland was $15.45 this year, and loaded it’s $16.75.

In the graph above you can see that minimum wage in Portland has been rising steadily (the red line) while the net dollars per hour generated by the farm has been less consistent (the blue line). That inconsistency is to be expected to some extent, although ideally it would generally trend upward. Instead it has generally trended flat. Part of this is probably that while minimum wage has been rising steadily at about 5% per year, while our prices haven’t. Labor (including owner labor which most people will record as profit, not labor expense) is consistently about 80% of our total expenses, so it has a bigger impact on our costs than any other factor by far.

In the graph above you can see how closely the gross and net before labor track, which just shows that our non-labor expenses are very consistent. From 2017 to 2021 we were growing a similar number of beds and just harvesting from mid-spring to mid-fall. In 2022 we changed our bed layout which gave us slightly more space and we started harvesting year round. The numbers don’t tell the full story here, but it does seem that may have been good for the income of the farm – part of the reason we did it. In 2023 we gave up about a quarter of the space we had been growing on to let Vicolo farm start up next to us. The impact there was complicated and I’ll talk about that after looking at the next graph, full-time-equivalents per acre versus actual.

Since 2017 we’ve had multiple people employed by the farm, but everyone, including me, works part time. In the graph above I’ve calculated how many people would have been working if they were working full time, and you can see it’s right around one person (the red line). The blue line is that number divided by the amount of space we were cultivating, and it’s very significant that the number jumps in 2023. That is literally why the average hourly wage was so low.

There were a few contributing factors here, but I think the most significant was that I made a mistake in my labor plan for the year, essentially not adjusting our projected labor needs down enough at the beginning of the year to make up for the reduced revenue from growing on less ground.

At the same time a couple other things happened that contributed: one was that I had unexpected turn over in my crew mid-season which meant hiring and training new folks mid-season; another was that I was terrible about limiting my own hours, especially during CSA pick up at the end of the day when I’m the least productive.

There are a number of fixed costs on the farm that don’t shrink even though the production area footprint and gross of the farm has shrunk, and that means we need to be a little more efficient with our labor and other production costs. Unfortunately I was the opposite of more efficient, and because I hadn’t budgeted properly at the beginning of the season I wasn’t getting the signal I should have when I was checking my numbers each month. I could see that we were a little over on labor, when in reality we were quite a bit over on the labor budget. 

Growing conditions for the year, the uncontrollable factor, were also not favorable, and that was compounded by growing conditions the prior year which had contributed significant weed seeds, which in turn increased the weed pressure and need for labor.

I have more thoughts on all of this, but I’m going to wrap up here for now. I will be offering a session on this kind of analysis and the record keeping that allows me to look at these numbers easily at the Oregon Small Farm Conference next month. I have some ideas for changes in 2024 to address the avoidable problems we had in 2023 and I’m also hoping, as I do every year, for favorable weather and lower pest pressure!

Build Your Own Farm Tools

When my second book came out a couple of years ago it was mid-pandemic so I wasn’t traveling to conferences, I was pretty busy with other projects, and not a whole lot of promotion happened. Still, a few people got copies and I’ve had a trickle of wonderful tags when folks have actually been inspired to build something based on the designs in the book. 

Since gift giving season is on us and some of you might be looking for gift ideas – how about giving a copy of Build Your Own Farm Tools? 

This week I’m going to post a few of the pages from the book with some of the parts that jumped out at me when I was flipping back through it this morning. I’ll add sample pages to this post each day for the next week or so.

Cover photos are by Shawn Linehan and were taken at Cully Neighborhood Farm and and 47th Avenue Farm (who is still using one of my basic #farmhandcarts more than a decade later – the design is in the book). 

All of the excellent illustrations are by Michael Gellaty.

Ask your local bookseller to order you a copy if they don’t already have it on their shelves, or order one from Growing For Market – it’s under $20!

Oh, and I just noticed on the back cover those lovely endorsements from Ben Hartman and Leah Penniman – they both have great books too so check those out as well!

The Drip Roller

Build Your Own Farm Tools is a collection of tools that I’ve built, used and found useful for many years. A perfect example is this simple to build drip roller based on one I first used on a farm in 1999. I don’t know who made the original but I’ve tried to improve on their design multiple times but keep coming back to more or less the original. For designs like this one there are important tips for how to use the tool base on my long experience using it. I also give tips for building the tools that can be used in other places, like the ones here on laying out the legs.

Ergonomics

I think about ergonomics quite a bit when I’m designing – basically designing for people to be efficient. That also means safe and healthy because it’s not very efficient if you and your workers are spending extra energy working around a tool that encourages or requires you to be in positions that are awkward or potentially damaging. 

One example is the way I size our spray tables for single workers, essentially an easy arm span wide (which conveniently is about 4’ on average, also the length of a bundle of lath) and an arm’s reach deep, or about 2’. This limits the unconscious tendency to extend and reach for things at the edge of a table that is too big. On a properly sized table nothing is far enough away to require reaching. This helps to protect your back and to save energy. 

There are lots more examples in the book, This just happens to be one that was illustrated. Also a little behind the scenes note: even though the book is illustrated almost every illustration had at least one, and often multiple reference photos. Ultimately it’s a little easier with a good illustration to highlight the really important parts of an image and to leave out potentially distracting parts, but it’s easier to start with photos and them strip them down to their essentials.

Glove Drying Rack

Today was a harvest day and this time of year especially we’re wearing a lot of gloves on the farm to keep our fingers warm. Inevitably those gloves get wet, ’tis the season. Probably the simplest tool in the book is the glove drying rack. Typically I’ve had an old wire hoop for holding up row cover or section of heavy fence wire to make these and it’s just a matter of bending a bunch of right angles in one and then drilling some wire sized holes at an angle in some wall studs, or a beam  to insert the ends into. Drying the gloves at an angle works better than vertical as it holds them open better.

Irrigation Systems

There’s a whole section on setting up irrigation systems for small farms, both drip and sprinkler. I get into the parts that I use in my systems, as well as how I size everything for available pressure and flow – and how to know what your pressure and flow is. 

On a side note, when I was looking back at the “Looking Closer” section on gravity and psi, it tells you what the water pressure is at the bottom of a 10 ft deep pool, but I started thinking about how that’s really the pressure above atmospheric pressure so it’s not giving you any perspective on why your ears feel that change, since 4.3 psi sounds pretty small.

The change from atmospheric pressure is the number you need for irrigation calculations but to give you a sense of how much change that is for your ears, at the surface of the pool you’re typically feeling about 14.7 psi give or take 0.14 psi depending on the weather and your elevation (this is atmospheric pressure at sea level, it drops as you go up in elevation). Diving to 10 ft in the pool increases that by 4.3 psi to 19 psi. In an airplane it goes the opposite direction, down to somewhere around 10 psi, similar to what you’d feel at about 8000 ft of elevation. 

Spreadsheets

It’s now late December and once again I’m appreciating the quick records I kept on paper through the season and how easy it was to transfer the ones I needed back to the spreadsheet that I did the planning on last winter to check on the actual dates to maturity for seedlings in the greenhouse, and lettuce crops in the field at different times of the year. I think it took me less than an hour to input and analyze all of the actual weeks to maturity on 185 greenhouse seedings and 30 lettuce plantings so I can update the plan for 2024. I’m about a month behind where I’d like to be in getting my 2024 planting plan finalized, but definitely better late than never in this case. 

Build Your Own Farm Tools has a section on the spreadsheet and paper as planning and record keeping tools. This time of year it’s the tool I’m spending the most time with for sure.

Mapping Out the Crop Plan

This is a companion article to my last post on crop planning using spreadsheets. A version of this article was published in Growing for Market’s February 2010 issue.

Maps in time and space

A basic spreadsheet application, like the ubiquitous Microsoft Excel, finds many uses in my farm office. It functions as a calculator, a database, an analytical tool, and a planning tool, and it even provides what I like to think of as a very editable piece of graph paper for making maps in time and space. I’ve been using these maps for a couple of decades now for planning out complex crop placements within fields, working out crop rotations, passing on instructions to field crews, keeping information dense, compact crop records, and as a cheat sheet in creating weekly and daily to lists during the season.

Time and space?

Most field maps that I see are maps of space showing the outlines of the fields, sometimes with the important dimensions and any relevant features noted. I do keep a copy of a map like this to use occasionally, and they can be made using a spreadsheet by doing things like adjusting the column widths and/or row heights, and merging or outlining cells. I usually have one tab of my spreadsheet workbook that has an overview map of the farm like this explaining the bed numbering system. But the map I use the most in planning is one that isn’t an overhead view, it’s one that includes a time axis.

My maps are more like a graph with the x-axis (columns) representing time and the y-axis (rows) representing the location within a field. One of these maps is easily made on a piece of graph paper or in a spreadsheet. First I make a header row (orient the paper portrait style so that the long edge is on top). For my header row I put a Monday date in each of the boxes along the top of the graph paper. Of course you’ll need a piece of paper with at least 52 boxes across the top to make this work as there are 52 mondays in a year. The first row below this represents the first bed in a field, the second represents the next bed, and so on. 

I also use this system in gardens, although many times garden beds are not very homogenous, comprising many plantings in a single bed. In this case I might use more rows to represent a single bed. As an example, on my current farm we have beds that are 160′ long, but we’re typically thinking of each one of those beds as four 40′ beds so each of the 40′ sections gets its own row.

Shorthand

I’ve developed a shorthand that I use to represent different common events within the bed. This allows me to fit a lot of information into a very small sheet of paper, and to easily and quickly interpret that information years later when I go back to figure out what happened to a particular crop, or bed in a field. All of this information is especially useful in planning future crops. The shorthand I use is for common occurrences that are noted many times, such as: H for harvest, M for mowing, T for tilling, and vertical lines to represent the start and end of a crop.When I do make additional notes I want to make sure that I’ll understand what I meant many years later and so I write them so that anyone on the farm could understand with relative ease. Time and again I’ve found that if I’m not very clear in my meaning that even weeks later I can’t remember what I meant by incomplete notes.

On the map each row represents a planting section and reading across a row you can see the progression of a bed through the season. Starting in the first block on a row (which represents the first week of the year) I’ll usually make a note of what winter cover crop is planted in the bed, when it was seeded and maybe how it was seeded. If the cover crop is mowed down and tilled in on the first week of May I’ll write MT (meaning mowed and tilled) in the block that represents the first week of May. When the crop is planted I make a vertical line at the beginning of the block and write in the name of the variety. Usually the next note is an H the week that the crop is harvested. If the crop is harvested for multiple weeks there are multiple H’s, one for each week the crop is harvested. When the crop is finished and turned in I make a solid vertical line at the end of the week, or half way through if something else is planted back into that bed that same week. 

There are plenty of other notes that could be made, but even just noting the planting week, harvest weeks and finish of the crop using just two lines, the variety name and H’s gives very valuable information for future planning with a minimum of effort and space.

The maps are also not the only place I keep records so I don’t need to capture every detail in the map. Primarily the maps are keeping records of what was where, and when. I keep separate planting and seeding records, greenhouse records, and harvest records, to name a few, and those hold more of the details, like what the spacing was on a crop, what seeder settings were used, and what the exact planting day was, not just the week it was planted.

I think it’s important to not try to make too many notes on the map as they can confuse more important information. Having said that, I do frequently make other notes when convenient and in places where they won’t interfere with taking future basic notes on the map. With crops where beds are harvested all at once I sometimes note the yield on the bed.

Occasionally I’ll note weeks of hand weeding, germination, flowering, or other things I know that I’ll want to remember and use in planning for years. If I’m trying to track how many times a crop gets hoed I’ll make note of the hoeing events in the the weeks that they happen. If I need more space to make the notes I use the margins and arrows, or earlier blank spaces, but I leave future blocks in case I need to make notes there later. 

Why use a spreadsheet?

The maps can be easily made with graph paper, but by using a spreadsheet, and putting a little work into the formatting, you can make something cleaner which optimizes the space on the sheet. In addition it is easy to create a header row on top with the Monday dates for the year, and a list of the bed numbers on the left side of the sheet. For the bed count on the side I use a simple formula which adds 1 to the number in the cell above. For the Monday date I enter the first Monday date of the year and then use a formula to add 7 to each successive cell which will automatically give the Monday dates for the rest of the year.

If you’re unfamiliar with using formulas in spreadsheets don’t be intimidated, they are relatively easy to learn and greatly improve your ability to use the sheets effectively. When I make my crop plan in the winter I transfer the plan to the spreadsheet maps, using gray background fill to indicate the weeks I expect the crop to be in the bed. I can easily visualize where everything will be, and when it will be there. I essentially do this manually and have not found it worthwhile to write formulas that will automatically generate the maps from the crop plan spreadsheet, although this could be possible. I like to leave a little more flexibility in the representation than formulas would give me and that’s the main reason I haven’t automated this part of the process.

Like all planning, the plans on the maps is not necessarily what will actually happen during the season, but it is an easy way to see if all of the crops planned for will actually fit into the fields at the times they are scheduled for, without conflicting with preceding or successive crops. Additionally, it makes double cropping and planning for cover crops easier as blocks with no gray fill are obviously available for plantings.

Once these crop plan maps are made they are also excellent for passing on the planting location to field crews. I’ve found this especially true for unusual plantings, such as ones where blank beds are to be left for future plantings, or where the sequence of varieties is important. 

Using the maps in the field

Though I use a computer to create the maps, once they are created in the winter I print them out and take all of my notes on the paper copies for the remainder of the season. I make a book using a three ring binder to keep the maps in. Every crop plan map has a blank map behind it. The blank map is where I keep records of what actually happens and I can compare that to the plan. I can also make notes on the plan if I want to make edits to the plan during the season. Once a week I walk through the fields and record everything that happened in the previous week. During the following week it is easy to use the maps as a quick reference of what crops are in the fields and what stage they are at, beds that are ready for planting, and ones that need to be prepared.

For highly diverse plantings this can make scheduling irrigation, tillage, and harvest much easier, especially if you have to pass on the locations of such operations to field crews. The following winter, during crop planning, all of the previous year’s planting weeks and actual weeks to maturity are easy to recall by looking at the maps. I would never give up walking through the fields regularly, but not having to walk out into the field to remember exactly how many beds of lettuce need to be watered, or prepared, or turned in for example, saves a lot of time during the course of the season.

Having a visual record of where, and when crops were in a field makes planning future rotations and planting dates much easier. It’s far easier to edit complex farm planting layouts on paper in the winter than in your head during the season. 

Sample Maps

You can download samples of the spreadsheets I’m talking about above here. There’s also a pdf version of a presentation I do on this same topic included there.

Using Spreadsheets for Crop Planning and Record Keeping

This is a version of an article I first published in Growing for Market’s November 2010 issue. For a long time it lived at joshvolk.com and now I’ve moved it here and have added some minor updates.

I have to admit I like farming on paper. I plan out my entire season: where everything goes in the fields, how much of what to plant, when it will be planted, how much I’ll harvest and when, all on paper. Well, not initially on paper, actually I do it on a computer and then print it out. It’s all so neat and clean and perfect on paper (or the screen).

I do also like going out in the field in the spring and actually doing the farming. At that point things frequently diverge from the plan, a bit, but having the plan keeps me focused and definitely keeps my stress level much lower. It also provides a form for keeping good records and using those records to improve the planning for the following year.

In the February 2010 issue of GFM I wrote about my method for mapping out fields and keeping records on those maps (I’ll put that article up here soon, too). There are two other steps to my process of making the maps that I didn’t really mention in that article: creating a harvest plan, and creating a planting plan. I use computer spreadsheets for all three of these steps in my planning process. If you’re already someone who is comfortable with computer spreadsheets I hope this article will give you some ideas for how to organize your planning in those sheets and more ideas for how to implement the sheets. If you’re not familiar with spreadsheets and you spend a lot of time in the office every year creating crop plans, perhaps this will convince you that this is a tool worth learning. If you’re a computer wiz and you’re familiar with creating databases or programming, you can ignore all of the spreadsheet references and translate the concepts into other platforms.

Since I originally wrote this article I’ve seen, and tried out, a few apps designed specifically for the kind of crop planning I’m talking about here. I haven’t found any of them to be better than using a spreadsheet on the whole. They do look a little slicker, and for someone who isn’t already familiar with spreadsheets they might even be slightly easier to understand. They’re not as inexpensive or as customizable though and so for my money I don’t think they’re as good a tool, yet.

I currently use Microsoft’s Excel. Over the years I’ve used a lot of different spreadsheet software platforms and they all have pluses and minuses, and for the most part are pretty interchangeable. I learned the basics of spreadsheets on AppleWorks back in the 80’s, and really it’s all still pretty similar. I think the first spreadsheet software I used for planning like this was called ClarisWorks (look it up, it’s been dead a long time and was the successor to AppleWorks). Excel was what I used when I was in college. At one point I used NeoOffice which was free and still might be around. For a few years I transferred all of my sheets into Numbers for Mac, which works a bit differently and was quite a learning curve. As software companies have a tendency to do, Apple kind of screwed that one up with updates that dumbed it down. Excel has been the longest lasting, although I’ve started to use Google Sheets more and more for other tasks and I know folks who use it to do their planning as it does most things Excel does, and make sharing simpler.

Everything I do on the computer could be done by hand on paper and if you don’t have a computer some of the techniques here will still be useful. The advantage of using a computer is that if you set up your spreadsheets properly they will automatically do calculations for you, and they are also easy to quickly sort in different ways. The computer is a tool and the spreadsheet programs are extensions of that tool. They are a tool that take a bit of skill to use well, just like most tools on the farm, so don’t expect to sit down and have the thing work for you first try. 

Examples of Spreadsheet Utility

The kinds of automatic calculations that I use vary. I use the spreadsheet to calculate dates. For example if I tell it I want to plant broccoli on April 1 and that it takes four weeks for broccoli plants to mature in the greenhouse it will tell me that I should seed the broccoli in flats on March 4. I also use it to calculate yield projections. If I expect a yield of 250 lbs of potatoes per 100 row feet, and I tell it that I’m planting 12, 180 foot beds it will tell me that I should expect 5400 lbs of potatoes. If I tell it I’m hoping to give 200 CSA members 3 lbs of potatoes 8 times from that one planting it will tell me that I’ll have a surplus of 600 lbs. There are many more examples but you get the idea.

There are a couple of keys here to making this work for you. First, you have to set up the sheets and the formulas that are calculating the numbers so that they make sense for you and they tell you what you want to know. You also have to put in good numbers at the start and make sure they formulas are correct. If your yield numbers are no good, the yield projections that the computer spits out won’t be either. 

Automatic calculations are nice but being able to sort large quantities of information quickly is probably even more useful. Once I have my plantings in the sheet, or even while I’m putting them in the sheet, I can sort them. I do all sorts of sorts: I sort them by crop so that I can look at all of my lettuce plantings for example; or I sort them by date so I can look at what’s being planted in a particular week; or I sort them by location so I can look at what’s being planted where. A word of warning, be very careful sorting, you can get into a lot of trouble here by disassociating connected parts of the sheet.

In another example of sorting I can pull out all of the transplanted crops, make a chart of all of the seeding in the greenhouse by seeding date and leave space on that chart for keeping records on what actually happens during the season. Then I print the chart out at the beginning of the season and a copy lives in the greenhouse for easy reference and record keeping, as well as another copy in my personal book for making to do lists. I make similar charts for seed orders, beds to be prepared, plantings, and harvests. More on those later.

Creating a Harvest Plan

The first step in my planning process for the season is to create my ideal harvest plan. For this step I make a chart which is similar to the field maps I wrote about in February. Across the top of the chart I list the harvest weeks of the year. I do all of my planning by week. If I were to plan for a specific day to do something it I’d probably be wrong 95% of the time. If I project a week that I’m going to do something I’m much more likely to be right and it’s nice to build in a little flexibility during a week.

If I’m making a plan for CSA harvest I fill in the number of units per share for the items under the week that I want to distribute each item. I can use the spreadsheet to give a count of the number of unique items planned for each week. I can also total up the projected value of the shares.

For other markets I make the same type of chart, but instead of a share by share quantity I put a total quantity.

Creating the Planting Plan

Based on the harvest plan I then create a planting plan designed to give me the quantities of the crops I want from the harvest plan, at the times I want them. The final step in the process is creating the maps (I’ll post more on those soon). The process is a bit circular because usually I create a harvest plan that is somewhat unrealistic, requiring too much space and that becomes most obvious when I create the maps, at which point I have to go back and edit the harvest plan and planting plan to match the space available.

For the planting plan my sheet is usually quite large and I carry as much information about each planting as possible within a single row of the sheet. Depending on the farm (I’ve created these for at least a dozen unique farms at this point) I modify the information I include, as well as the formulas that do the automatic calculations. I’ll give an example of the type of information that I include for each individual planting based on my very small farm. 

I start with the crop type and then the variety. I use the next group of columns to create a yield calculator. For example, I put in columns for the unit (pounds, bunches, etc.), a typical yield for a known space, the price per unit, the number of weeks I want to harvest from that planting, and the quantity I want to harvest each week (information that comes from the harvest plan I’ve already made). Formulas in other columns then tell me how much my total expected yield is, how much of that I need for my market, and how much is surplus, as well as projecting a gross income from that planting. I don’t always use this section for all of my crops, but it’s helpful if I’m trying to guess how much of a new crop to plant, or if I want to get a sense of how much a planting might gross.

The second group of columns is all of the planting information needed in the field. Is the crop direct seed or transplant? How many rows in a bed? What’s the in line spacing? What field is it going into? How many beds are being planted (or fractions of beds)? What week are we hoping to get it in the ground? And, any special notes for the planting. Some of those formulas in the yield calculator use some of this information, and all of it is useful to give to a planting crew to make it absolutely clear how to plant the crop.

My third grouping of columns is a harvest projection calculator. Like the yield calculator section this is mostly useful for figuring out how to adjust planting weeks in order to get as close as possible to a hoped for harvest week. It includes data fields for catalog days to maturity and “actual” weeks to maturity, which are based on past experience, or best guesses. Using the actual weeks and the planting week it calculates a projection of the first harvest week, and if given a number of weeks that the planting is to be harvested it will also give the final harvest week projection.

A fourth grouping gives all of the information necessary for growing starts in a greenhouse. For direct seeded crops these fields are left blank, but if the crop is to be transplanted, and therefore started in the greenhouse, all of the information that the greenhouse crew needs is here: the week to seed the starts which is calculated from the planting week and the weeks to maturity in the greenhouse, the number of plants needed based on the number of beds and the spacing, estimates of the number of seeds that should be seeded based on a generous cushion and the germination rates of the seeds, plug tray sizes to use, the number of trays to seed, and any special notes on the seeding. For direct seeded crops there are a separate group of columns that detail the seeding method to be used, any seeder settings and particular notes.

Finally there is a group of columns for planning and organizing seed ordering. This starts with a section that estimates the number and weight of seeds needed for the planting to help with selecting the most appropriate quantity when looking through seed catalogs. There are also columns for indicating the seed company to order from, the order quantity, the order code and the cost.

I want to reiterate that every single separate planting gets all of this information included – except some of the seed ordering information that I’ll talk about later. So, if you are planting three different carrot varieties into one bed on the same week, each one of those would be considered a separate planting. Similarly, if you’re planting four beds of the same carrot variety for three weeks in a row, that would be considered three separate plantings. 

This might seem like a lot of repeated information, and it is, but it’s relatively easy to copy much of the information over from similar plantings. Also, during the season this really makes it much clearer to everyone on the crew what the plan is for any individual planting. 

The only columns that I don’t repeat information in are the seed order columns. For most varieties I’m performing multiple plantings each season, which means that the total quantity of seed that I need of that variety is the sum of all of those plantings. For seed order information I consolidate the seed order information for each separate variety into the first seeding of the year to keep things less confusing. 

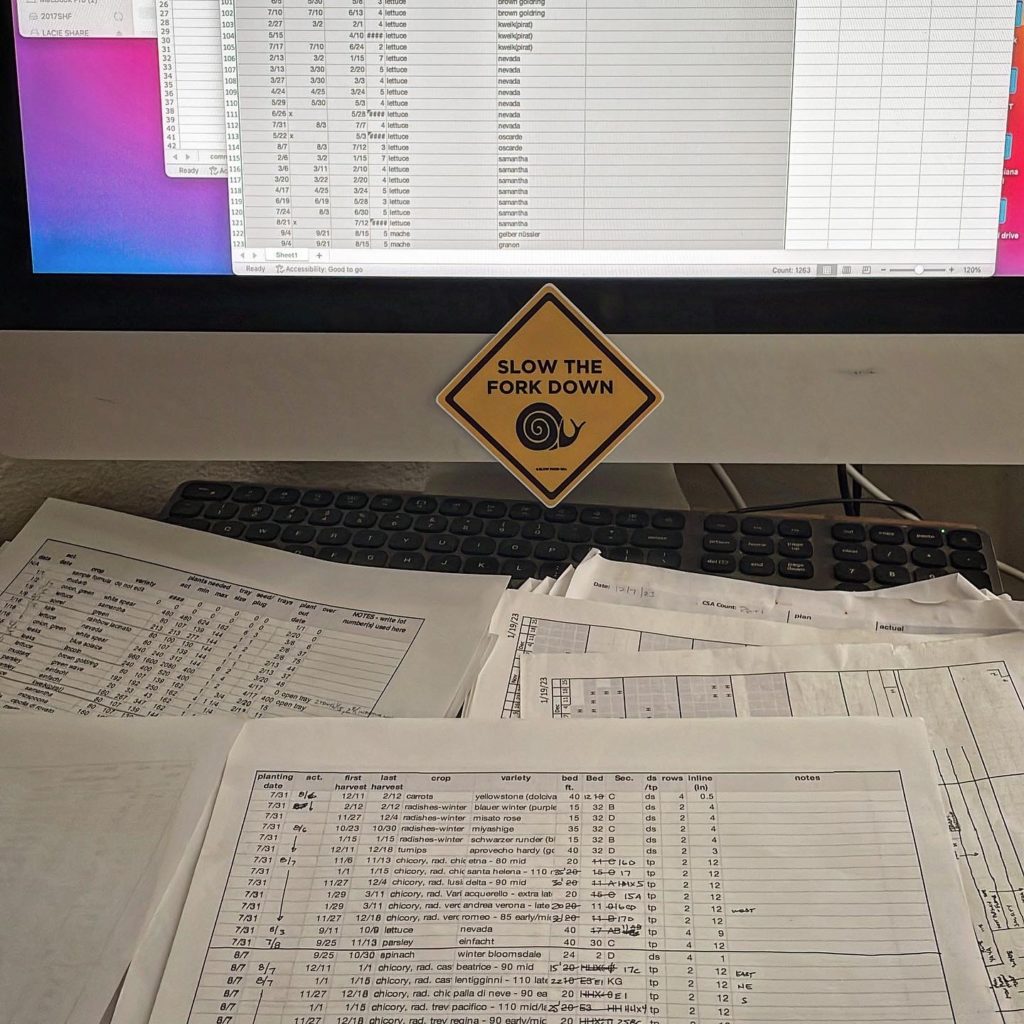
The resulting spreadsheet is very large, usually over 50 columns wide and over 400 rows deep. It is far too big to be able to print out and use on paper in its raw form.

How to Organize All of this Information

If you were going to do something similar on paper, each row would be like index card. There would be an index card with each planting on it and all the corresponding yield, planting, seeding, and seed order information. You could rearrange the index cards by planting date, or by crop, or by variety, or by seed company to order from, etc. but it would take a bit of time considering there would probably be hundreds of them. With the computer you can just sort the rows depending on how you want to use them.

Once I’ve gone back and forth a few times between the harvest plan, the planting plan and the maps to make sure that it all fits and makes sense I’ll consider the plan solid and I’ll start breaking the information apart into separate sheets that are useable to make the seed order, to create a bed preparation schedule, a transplanting schedule, a direct seeding schedule a greenhouse seeding schedule and a harvest record sheet.

Computer spreadsheets allow you to reference selected information from other sheets in creating a new sheet, and to combine those pieces of information with new information. The first sheet I usually create for myself is the seed order. For this sheet I pull out only the information I need to make the order and then I sort the sheet by seed company so that all of the orders are separated for me. At that point I simply have a list that I can read down for each separate seed company, and I have all of the order numbers and prices to compare as I go. I make notes on a print out as I go to keep track of back orders or items that aren’t available so that I make sure to order those from other companies, or so that substitutions are noted in the planting plan. 

The rest of the sheets that I make are designed to include the information that is needed only for the task being performed (e.g. direct seeding, or greenhouse seeding), and I also include blank columns next to numbers I want to have records of. I make sure that the information on the sheet can be printed out on a single sheet of letter sized paper, without any of the row flowing over onto a separate sheet. That way all of the information for a planting is contained on one line and is easy to see in a glance. For example, when the planting crew goes out into the field, they have a clipboard with a sheet that tells them the crop, the variety, how many trays they should have gotten from the greenhouse, what the week of the planting should be, what field the planting is going into, how many beds are to be planted at what spacing, and any additional notes. The sheet is sorted by date and field so that all of the plantings for the week are grouped together, and within a particular week they are grouped by the field they are going into. There are also blank spaces that the crew fills in after planting to note what day the crop was actually planted, where it was planted, and then they can also note any changes to the information given. These sheets are both the to do list and the record sheets indicating not only that the task was done, but also when and how.

Timeline

This entire process is not a short one. Plans often include 400-600 separate plantings in one season. Even when it’s just being edited from a previous year and not created from scratch, I give myself two full weeks of sitting in front of previous years’ records, a computer screen and lots of seed catalogs to complete the process. Usually that two weeks is spread out over a month or two. Here in the Northwest I like to do my planning in November, hoping to finish before the New Year and have my seed order in by early January. We start seeding in the greenhouse in late January so it’s easiest if I’m all done by then and the seed is already arriving.

With the plan finished and printed out on paper, I pretty much leave the computer spreadsheets behind for the season and work entirely off of the print outs that I make in January. Even though there are frequent edits to the plan over the course of the season due to weather, labor, and unforeseen pest issues, having a plan saves an incredible amount of time during the actual growing season, moving a chunk of the decision making to the “off” season, when there’s more time to think decisions through. Further, on a farm where you, as a manager, have to pass on all the details to a crew, or crew leaders, having those details spelled out in a standard format that they can easily access saves a lot of communication time, and makes tasks clearer. When the crew is good at keeping records it is easy to see what has already been done, and what is still remaining to be done, just by glancing at the combined to do/record sheets. 

I’ve taught numerous farmers to use this system over the years. My partner, who managed one of the farms that I used to work on, was one of those people and she told me it took her two or three seasons of going through the process to really understand the details. Another advantage I see to creating such detailed plans, especially in conjunction with good record keeping, is that it accelerates the learning process for how to plant out the farm successfully. At this point, after many years of farming I might be able to plant out the farm from shear seasonal muscle memory. When I was first starting, there was no way I could do that, and so creating the plan in the off season gave me a real head start to understanding what I needed to plant, how much, and when.

Additional Tips for Using Excel

The following is a cheat sheet of features I find useful to understand in computer spreadsheets that I’ve created for workshops that I teach on my crop planning method. Learning how to sort effectively is the one other essential skill not mentioned below.

Useful excel shortcuts and terms

  • Cell Address – the column letter followed by the row number (e.g. F35)
  • relative cell address – when you put a cell address in a formula it defaults to a relative cell address, meaning relative to the cell the formula is in. The cell address in the formula will change if you move the formula to another cell.
  • absolute cell address – you can make the column, or row, or both absolute (meaning they won’t change if you move the formula to another cell). This is done by putting a $ in front of the letter, or number, or both (e.g. $F35, F$35, or $F$35 – meaning three different things)
  • Referencing – this lets you reference cells in other sheets, even other workbooks. This works just like other cell addresses. Be aware that if you move cells in the referenced sheet (by sorting or any other method) the cell will still be referenced but the information that was in it will not.

Formulas I use in crop planning

  • =+-/*() – pay attention to where your parenthesis are in the formula, it makes a big difference sometimes.
  • +- – adding (or subtracting) a number to a date is equivalent to adding (or subtracting) days. Very useful.
  • sum() – this adds up all of the cells in a range. Ranges of cells start with the top left cell address, are separated by a colon (or sometimes double periods), and end with the bottom right cell address (e.g. A1:C55, or A1..C55)
  • count() – This counts the number of cells in a range that have a number in them
  • countA() – This counts the number of cells in a range that have anything in them
  • If() – I used to use more if statements but they take up a lot of space and aren’t really so useful in the end. Basically they will do one thing if a cell matches the criteria you’re looking for, or something else if it doesn’t. 
  • Nesting formulas – I use a lot of formulas inside of formulas. You can nest a lot of formulas but usually it’s easier to use multiple steps, showing each intermediate step in another column. This is much easier to edit in the future and to understand when you forget how the formula works.

Learn key stroke shortcuts

These save a lot of time when you add up how many times you use most of them, and they help save your wrists. the most common ones I use are below. I’ve also included some right click features on a pointer. I say ctrl below, but on a Mac it’s usually command.

  • arrow keys – I find these faster and more accurate than the pointer (mouse/trackpad) in most cases
  • tab will move you one cell to the right, shift tab will move you one cell to the left
  • holding shift – this allows you to select a range by simply selecting the first and last (or last and then first) cells in the range
  • holding ctrl (command on a mac)- this allows you to select multiple, non-contiguous cells (mostly for deleting, doesn’t work with copy and paste)
  • ctrl x, c, v – cut, copy and paste. right clicking on a mouse gets you there sometimes but the keyboard is usually faster.
  • ctrl d, r – fill down and fill right. I use these a lot. These paste whatever is in the top or left cell into all of the other cells in a range. Unfortunately NeoOffice doesn’t have ctrl r so you have to use copy and paste instead.
  • ctrl b, u, i – bold, underline and italic. Once turns it on, a second time turns it off. 
  • ctrl s – I don’t use this one nearly enough – Save your work often!
  • right clicks – on row and column headings you can add and subtract columns
  • right click is a shortcut to formatting the cells as well.
  • scrolling – having a mouse with scrolling is very nice for working on spreadsheets. I’m excited about the new mice (and track pads) that allow scrolling in both directions (something that was relatively new back when I first wrote this).
  • Help – use the help feature when you can’t remember how something works. It’s usually the top right pull down menu. These days just asking google how to do something in Excel is often the best.

Sample spreadsheets

You can download samples of the spreadsheets I’m talking about above here. There’s also a pdf version of a presentation I do on this same topic included there.

Hiring a farm worker

Head over to the blog at Cully Neighborhood Farm if you’re interested in working with me and the rest of our great crew at at little urban farm on Mondays and Thursdays. This is appropriate for anyone interested in the work, no experience or completely overqualified – I’ve been lucky to work with a ton of great folks over the years of all levels – mostly you just need to be a good person, with good communication and ability to get things done. Job starts pretty much immediately on hire.

Group Coaching Session

Friday morning I’m hosting another virtual group coaching session for growers who want to talk more about planning and record keeping on the farm. If you’ve already filled out the interest form on my website at some point you should have received an email link this afternoon. If you haven’t signed up yet, you can find the link and sliding scale pricing at slowhandfarm.com/consulting

2021 Numbers

Every year I post my summary of the past year’s farming financials. 2021 was a rough one, and we were down on the number that matters the most to me, net dollars generated per labor hour. For the last five or six seasons (I’m too lazy to look back at this exact moment) I’ve been farming at Cully Neighborhood Farm and we’ve been trending upward, but with some variation. I’m hoping 2021 was an anomaly.

Here are the basics:

Total Labor Hours: 2265

Farm Gross: $43,083

Non-Labor Expenses: $9,203

Net Dollars per Labor Hour: $14.96

If you follow links back to previous years (here’s the link to 2020) you’ll notice that our gross was actually up by a decent amount, yay! Our non-labor expenses were also up, not by much, but a little. The big difference was that our total labor hours were up, a lot!

That difference in labor hours has a good side – it means we employed people for more hours than in past years. Unfortunately, all that extra labor didn’t translate into enough extra income to make up for the number of hours we added.

The way last year went, none of this was a surprise. I track this monthly, so I knew it was happening at the moment and I was making adjustments as best as I could. Unfortunately for us a number of things all went wrong during the year, some more significant than others, but they also all added up to more labor.

Here are some of the factors that led to higher overall hours. One was that I had folks start working earlier in the year than usual, hoping that would pay off in getting the farm and everyone working in shape and saving us hours later in the season. Unfortunately that coincided with employee turnover – for a positive reason, but still necessitating time hiring and training. At the same time we had a major off farm injury for another employee – not positive at all, but fine in the end. The combination of those two events, which happened close together, made it very difficult to plan labor needs using a completely new crew, and I over compensated a bit which added a bunch of hours early in the year. We never completely recovered from that, cost wise, but we did have a good year, crew wise. I also started spending longer hours at the farm, and that didn’t help as my hours are also accounted for in there, and I probably wasn’t as productive at the end of long days as I would have been with shorter days.

A hard to quantify change to the farm last year was moving all of our propagation of vegetable starts from our original greenhouse just down the street, to a smaller one in my backyard. The biggest change there was probably just in the learning curve that any new system entails, and time spend trying to recreate all the little details of our old system.

The other thing that we dealt with, which took extra time more than anything, were numerous escalating vandalism events through the season. Again, none of that on its own would have made a significant dent, but all together it really added up.

2022 is probably going to be another interesting season. I’ve changed up a number of the fundamentals on the farm – field layout, CSA seasons, and plans for a new wash/pack area layout. I’ll keep track of all of this and I’ll report back here on the results early next year.

Workshop Updates

A quick note here just to say that I added a few upcoming workshops to the list. They’re coming up soon and have limited capacity so if you’re in Missouri don’t wait to check out the details.

The blog’s been silent for a while, but I’m going to try to change that this year – we’ll see what happens there. I’m a little more consistent with my Instagram, and that usually feeds my Facebook, too, but I’d like to get back to the blog more often so I’ve set that as a goal. The most consistent posting I do is during the harvest season over at cullyneighborhoodfarm.com so you can check that out if you’re looking for what’s happening in the fields.

2020 Numbers

In December, once all of the labor, income and expenses were pretty well set for the year, I ran my annual calculation for net dollars generated per labor hour. I have done this for most years I’ve been at Cully Neighborhood Farm, and I started doing it back when I first started Slow Hand Farm as a way to compare year to year in a way that somewhat independent of growth and changes to marketing and growing methods, gives me an idea of how well I did financially for the number of hours worked.

You can follow the crumbs back through the years by following this link. For 2020 here are the basic numbers:

Total Labor Hours: 1987

Farm Gross: $41,000

Non-labor expenses: $8070

Net Dollars per Labor Hour = $16.57

This is slightly higher than last year, which I’m happy to see. It was a very different year to say the least. I’ll attribute the slight increase largely to returning crew members and some excellent day labor contributions at key times of the year. It wasn’t our best year, but considering all of the added expenses and stresses between Covid and the extended hazardous smoke conditions I’m happy we did as well as we did.  

One thing that I’ve heard some other experienced farmers say, and that I feel like I’m seeing as well, is that when we’re a little over our labor budget early in the season it’s actually probably a good thing, setting us up for better yields and less weeding labor later. That was the case this year. 

I’ve written a more detailed article in Growing For Market that should be out soon on why I think the Net Dollars per Labor Hour is a good metric to track and that should be out soon.