

It seems that last year I forgot to make my annual blog post summarizing the numbers for the farm’s prior year, so I’ll fix that here and give the update for the last two seasons. Short headline should be that 2023 was by far my worst farming year, financially speaking, ever. Embarrassingly so – but I’m still learning and these blog posts on the numbers are all about sharing to encourage others to run their numbers, learn and share, too, so here we go.
Partly because 2023 was so bad, and partly because I’m in the middle of planning out some changes anyways I spent a little more time with the numbers this year and generated some nice graphs so I’ll share a bit more than I usually do. The last one of these posts was on the 2021 numbers and you can see those by following this link (or just searching for “numbers”) in the search box.
The main number I track from year to year is what is best described as the “net dollars per hour generated” by the farm. Simply, this is the total revenues minus the non-labor expenses, divided by the total number of hours worked by everyone on the farm – including me, the owner. You can go back into the earlier blog posts for more on some of the things that can complicate putting this number together. I think of it as kind of an average hourly wage on the farm across all of the people who work on the farm.
For 2022 the number was $18.19 per hour, which was actually the best number I’ve recorded in past 7 years of tracking at Cully Neighborhood Farm. I had a very similar number ($18.17) in 2018 and that year I was able to give good bonuses to employees. Because the minimum wage was much higher in 2022 than in 2018, and more employees were above the minimum wage, that didn’t happen last year.
In 2023 the number was $11.74 per hour, well below minimum wage. When that average hourly wage drops below the loaded minimum wage it means that the employees are making more than the owner. By loaded minimum wage I mean minimum wage plus payroll taxes. Minimum wage in Portland was $15.45 this year, and loaded it’s $16.75.
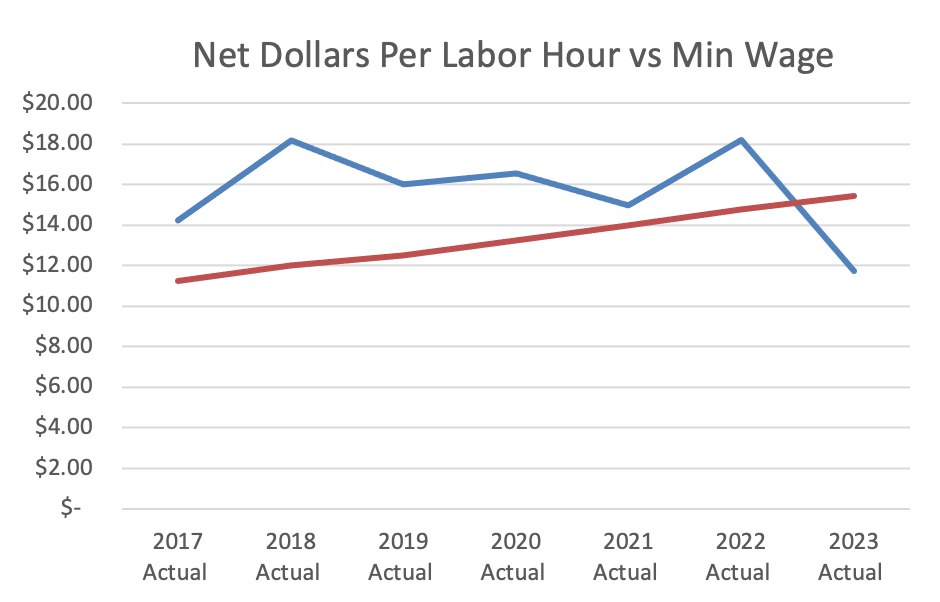
In the graph above you can see that minimum wage in Portland has been rising steadily (the red line) while the net dollars per hour generated by the farm has been less consistent (the blue line). That inconsistency is to be expected to some extent, although ideally it would generally trend upward. Instead it has generally trended flat. Part of this is probably that while minimum wage has been rising steadily at about 5% per year, while our prices haven’t. Labor (including owner labor which most people will record as profit, not labor expense) is consistently about 80% of our total expenses, so it has a bigger impact on our costs than any other factor by far.

In the graph above you can see how closely the gross and net before labor track, which just shows that our non-labor expenses are very consistent. From 2017 to 2021 we were growing a similar number of beds and just harvesting from mid-spring to mid-fall. In 2022 we changed our bed layout which gave us slightly more space and we started harvesting year round. The numbers don’t tell the full story here, but it does seem that may have been good for the income of the farm – part of the reason we did it. In 2023 we gave up about a quarter of the space we had been growing on to let Vicolo farm start up next to us. The impact there was complicated and I’ll talk about that after looking at the next graph, full-time-equivalents per acre versus actual.

Since 2017 we’ve had multiple people employed by the farm, but everyone, including me, works part time. In the graph above I’ve calculated how many people would have been working if they were working full time, and you can see it’s right around one person (the red line). The blue line is that number divided by the amount of space we were cultivating, and it’s very significant that the number jumps in 2023. That is literally why the average hourly wage was so low.
There were a few contributing factors here, but I think the most significant was that I made a mistake in my labor plan for the year, essentially not adjusting our projected labor needs down enough at the beginning of the year to make up for the reduced revenue from growing on less ground.
At the same time a couple other things happened that contributed: one was that I had unexpected turn over in my crew mid-season which meant hiring and training new folks mid-season; another was that I was terrible about limiting my own hours, especially during CSA pick up at the end of the day when I’m the least productive.
There are a number of fixed costs on the farm that don’t shrink even though the production area footprint and gross of the farm has shrunk, and that means we need to be a little more efficient with our labor and other production costs. Unfortunately I was the opposite of more efficient, and because I hadn’t budgeted properly at the beginning of the season I wasn’t getting the signal I should have when I was checking my numbers each month. I could see that we were a little over on labor, when in reality we were quite a bit over on the labor budget.
Growing conditions for the year, the uncontrollable factor, were also not favorable, and that was compounded by growing conditions the prior year which had contributed significant weed seeds, which in turn increased the weed pressure and need for labor.
I have more thoughts on all of this, but I’m going to wrap up here for now. I will be offering a session on this kind of analysis and the record keeping that allows me to look at these numbers easily at the Oregon Small Farm Conference next month. I have some ideas for changes in 2024 to address the avoidable problems we had in 2023 and I’m also hoping, as I do every year, for favorable weather and lower pest pressure!